Power
WAverage power output through the drive, the headline number for how hard you are working.

What XBoat measures on the water and in Analytics.
Average power output through the drive, the headline number for how hard you are working.
The maximum force applied to the oar during the drive.
The oar angle at which peak force occurs, showing where in the stroke you load hardest.
Where peak force lands as a percentage of the drive, ideally early and smooth.
Total work done per stroke, the energy you put into moving the boat.
Your on-water output expressed as an equivalent ergometer split for easy comparison.
Oar angle at the catch, measuring how much reach you get at the front end of the stroke.
Oar angle at the release, showing how far you draw the stroke through to the finish.
Total oar arc from catch to release, the full sweep of each stroke.
The part of the arc where the blade is locked on and actually moving the boat.
Connected length as a share of total length, a measure of how much of your stroke does useful work.
Wasted arc at the catch before the blade fully connects and drives the boat.
Wasted arc at the finish as the blade washes out before the release.
Stroke rate in strokes per minute, your cadence on the water.
Time spent in the drive phase of each stroke.
Time spent on the recovery between strokes.
Drive time as a share of the full stroke cycle.
Recovery time as a share of the full stroke cycle, the other side of your rhythm ratio.
GPS measured speed of the boat through the water.
Time to cover 500 meters at your current pace.
How far the boat travels with each stroke, a measure of efficiency.
How much the boat slows at the catch, showing how cleanly the crew changes direction.
Live heart rate during the row when paired with a compatible monitor.
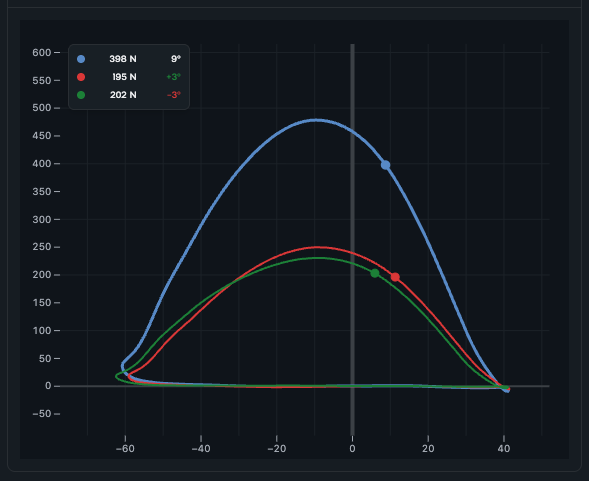
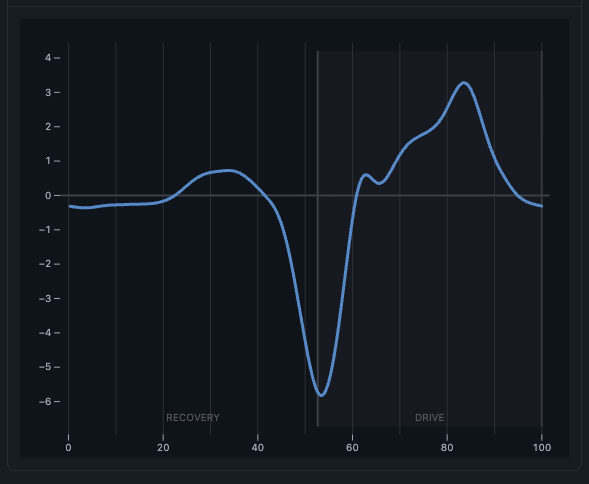
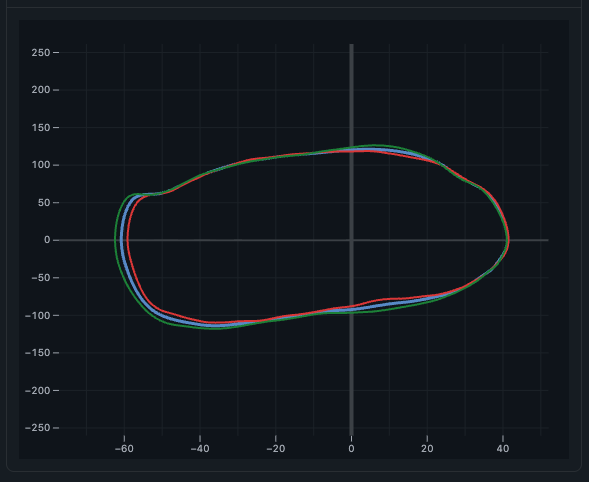
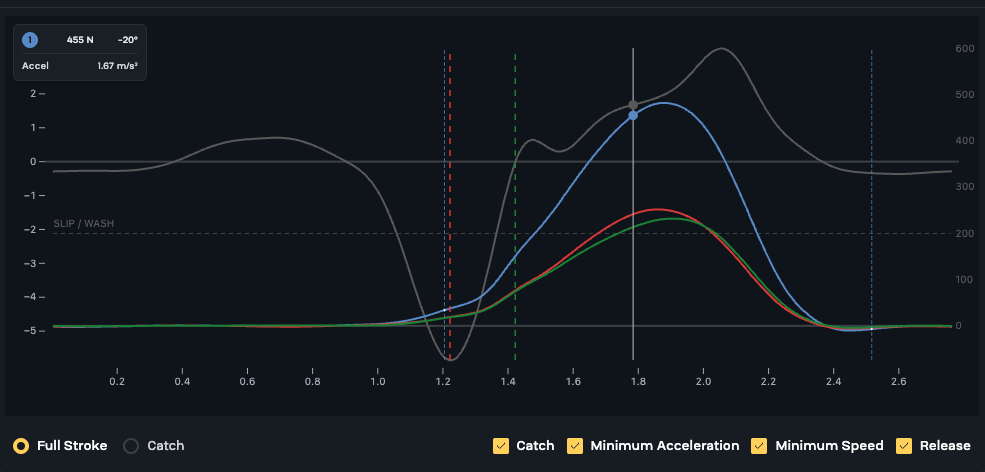
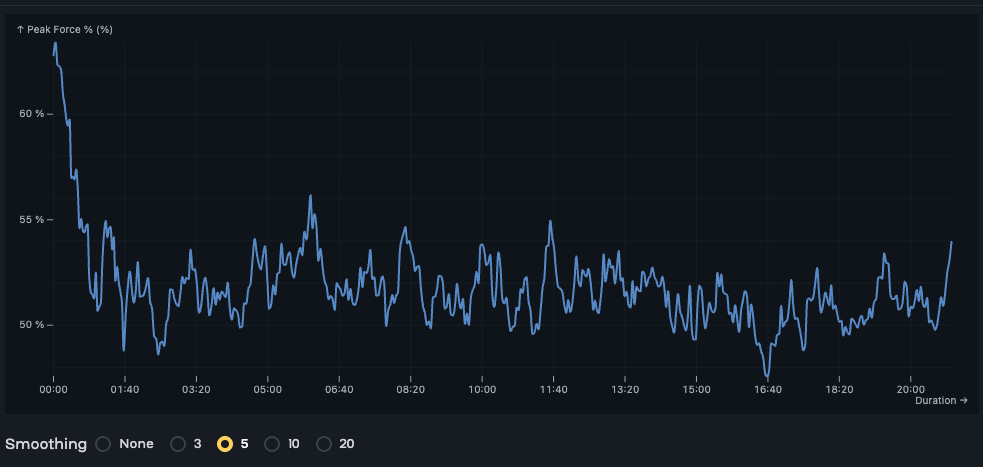
Some of the data visualizations available in XBoat Analytics.
Precision data, ready the moment you dock.